Saturday, 12 May 2012
Margin and Leverage
In a forex trade conducted through a trading platform, you are only speculating on the currency exchange rate and not actually buying all that currencies. Therefore if you speculate the movement of currency rates accurately you make a profit, otherwise not. Margin trading and leverage originate from this belief that speculation in currency positions can be met without real money supply.
Before we learn about Margin trading and Leverage it’s important we try to understand what is meant by lots.
Lots
Units of currencies are bracketed and traded in lots. Lots could be any of the following: “Standard" lots, "Mini" lots, "Micro" lots, and "flexible" lots (also called “fractional" lots).
"Standard" lot: Consists of 100,000 units of the base currency in a currency pair.
"Mini" lot: Consists of 10,000 units of the base currency in a currency pair.
"Micro" lot: Consists of 1,000 units of the base currency in a currency pair.
"Flexible" lots (also called “fractional" lots): In this case you could choose your lot size as for instance it could be 0.5 of a lot, 1.2 of a lot, or any other number of units that suits you. Flexible lot is unlike the set lot sizes you could have with Standard lots, Mini lots and Micro lots.
Example
If you traded 1 standard lot of the currency pair USD/JPY, you're trading $100, 000, if you traded a mini lot it is $10, 000, and if you traded a micro lot it is $1,000. In short, a lot simply indicates how much of currency you are trading in that lot.Remember it is the base currency we are referring to when we talk of lots.
The choice of different lot sizes allows you to fine tune your trading style. For example if the invested funds in your forex trading account is on the smaller side, having an account with a dealer who offers micro or fractional lot sizes helps keep your risks on the lower side.
Leverage and Margin
Leverage is the method by which you could control a significant amount of money in forex trading by borrowing a large portion of the capital required for trading(from your broker) and using very little of your own money.
For example, “a $100,000 position (standard lot) in forex trading can be controlled by using just $1000 of your own money.” The leverage in this case is 100:1 (which is the ratio of 100,000 to 1000). Remember leverage is always numerically expressed in terms of ratios.
For arguments sake supposing the leverage in the above example was 1:1. What would be the situation then? It would mean that you would be putting up- front the whole value of the position i.e. $100,000 as deposit and your borrowing would be nil. The 1:1 leverage would then look confusing as you are not borrowing anything, but nevertheless that’s the way it is. Retail forex trading is never done that way putting in the whole value of the currency position. On the contrary leverage is always used.
What is margin and how does it correlate to leverage?
To understand “margin” let’s refer to the earlier statement “a $100,000 position in forex trading can be controlled by using just $100 of your own money”. This statement obviously refers to a leverage of 100:1.But significantly margin refers to the $1000 deposit you had to invest in order to avail this leverage. In other words, margin is collateral that you have to give your forex broker to conduct your forex trade using leverage. Margin helps secure your trade with your broker.
Earlier we learnt that leverage is expressed in ratios. What about margin? How is it expressed?
Margin is usually indicated as a percentage of the full amount of the position. It could be 1%, 2%, 3%, 5% or even 0.25% and 0.5%. Different brokers have different margin norms. Once you know your broker’s margin requirement you can figure out the maximum plausible leverage that can be availed in your trading account.
Calculation that links leverage and margin
Say your broker has stipulated a margin of 5%. Theoretically it means for a $100 position you need $5. So for standard lot of $100,000 you would require (100,000 x 5) divided by 100 =$5000. This means for a $100,000 position the broker would expect you to put a margin of $5000 which translates to a leverage of 20:1 (100,000 divided by 5000). Similarly you can calculate the maximum possible leverage for different margin requirements as for example for 3%, 2% and so on.
As you can see from above calculations, although leverage and margin are interrelated, leverage does not equal margin. Here’s how different margin requirements could translate to maximum possible leverage.
Margin Leverage
0.25% 400:1
0.5% 200:1
1% 100:1
2% 50:1
4% 25:1
The concept of Margin per se explained above should not be confused with other similar terminology that you could get to see in your trading platform( as for example account margin, used margin, usable margin etc).
To reckon with this possible confusion, let’s try to understand the different variants of this terminology.
Margin required: Corresponds to what we talked of earlier and refers to the concept of margin as expressed in percentage. In simple terms it’s the amount of money you have to deposit with your broker to open a position.
Account margin: This indicates the sum of money in your forex trading account with your broker.
Used margin: When you open a currency position, your broker will lock in a certain amount of money to keep your position alive. Although this money is technically yours, you cannot utilize it furthermore unless and until your broker returns it to your account margin either when you close the position or when margin call occurs.
Usable margin: This indicates the amount of money remaining in your account to open new positions. Call it clear balance if you like!
How leverage magnifies the profit and loss.
Let’s assume the $100,000 position with 1:1 leverage (which means you invested the entire cost of the position yourself and had no borrowings) has now risen in value to $102,000. This means you have made a $2000 profit and your rate of return would be a mere 2% ($2000 profit divided by $100,000 money you invested as deposit)
But supposing you had a leverage of 100:1 and the $100,000 had risen to $102,000? In that case you would have invested only $1000 of your own money and the remaining $99,000 would have come as a loan from your broker. But importantly your rate of return has increased manifold, and in this instance would be 200% (divide $2000 profit by $ 1000 initial deposit and multiply that figure by 100).
As you can see from the above examples, a 1:1 leverage got you a mere 2% rate of return while a 100:1 leverage got you a 200% return.
Leverage is often referred to as a double edged sword. What does this mean? In the examples we talked of earlier the investment had made a profit of $2000(i.e. $100,000 had risen to $ 102,000).What if it is the other way around?
For example say on a 1:1 leverage what if the value of the position had declined from $100,000 to $98,000. This means you lost $2000 which means a negative rate of return (-2%). If the same deal was made on a leverage of 100:1 it means even more negative rate of return (-200%). What this means is that, just as increased leverage contributes to greater profits when the trade goes your way, similarly if the trade were to go against you increased leverage will certainly result in greater losses. This is what is meant by leverage being a double edged sword.
Margin Call
Margin Call is a call from broker to trader (either phone call, email or alert in the trading platform) asking him/her to deposit more money in the trading account failing which some or all of his trades will be liquidated by the broker at the current market price.
Why and when will the broker make a Margin Call?
Generally a broker will liquidate any position that is losing more than 50% of the margin (this is called Minimum Margin) it uses. The reason why it happens is to preclude the possibility of your loosing more money than you had originally invested.
How a margin call occurs is best explained by this theoretical example.
Let’s assume you are trading in a Mini account with 1% margin and have deposited $10,000. You then buy 1 mini lot of EUR/USD. Your account info snapshot will look as follows.
Account No. Balance Equity Used Margin Usable Margin
001 $10,000 $10,000 $100 $9,900
Supposing you had closed this position by selling it at the same price as it was purchased, then your account information snapshot would have reverted back to:
Account No. Balance Equity Used Margin Usable Margin
001 $10,000 $10,000 $0 $10,000
But you didn’t close the position. On the contrary you decided to keep going.
Assume you decide to buy a further 60 lots of EUR/USD making it a total of 61 lots
Your account info snapshot will now look as follows.
Account No. Balance Equity Used Margin Usable Margin
001 $10,000 $10,000 $6,100 $3,900
From the above consolidated position you stand to make great profits if EUR/USD rises as you had expected. But it will be a terrible scenario if EUR/USD falls
Assume the EUR/USD starts to fall, in which case your Equity will fall too. Your Used Margin will remain at $6100. But once your equity equals the used margin or drops below $6100, you will have a Margin Call. This means that some or all of your 61 lot position will immediately be closed at the current market price, unless you take steps to increase your equity to bring it sufficiently above the used margin. This basically explains how a margin call could be triggered.

FX .Currency Pair and Price
Currency pairs are financial instruments traded in forex markets. Every pair of currency traded in the forex market is considered as an individual product (or financial instrument). A set of two currencies always constitute a currency pair, of which one currency is being bought by the other. The buying and selling of currencies from around the world constitute currency trading. Currency Symbol Each currency has its own symbol as for example: For the Euro, it is EUR For the Japanese, it is JPY For the Pounds Sterling, it is GBP For the Swiss Franc, it is CHF. XXX/YYY is the general format by which currency pairs are denoted, where XXX and YYY both refer to the ISO 4217 international three-letter code of international currencies. Currencies are always traded in pairs, and here are a few examples of currency pairs: For Euro-Dollar pair, it would be EUR/USD For Pound Sterling-Dollar pair, it would be GBP/USD For US Dollar-Canadian Dollar, it would be USD/CAD For Australian dollar-US dollar, it would be AUD/USD For Dollar-Swiss Franc pair it would be USD/CHF and so on for other currency pairs according to their three-letter currency codes. 80% of all trades in the Forex market originate from these currency pairs. Consider this example of a currency pair GBP/USD. In this example of a currency pair, the currency on the left (GBP in this case) is called the base currency. The currency on the right (USD in this case) is called the quote currency (also called counter currency).The base currency (in this case GBP) always has a value of 1 in exchange rate. In the currency pair GBP/USD, GBP is being bought, and the value of the currency on the right (USD in this case) represents how much of the base currency it is worth. Consider another example of a currency pair EUR/USD 1.2436. This simply means 1 Euro is equal to 1.2436 US Dollars. Or it means that 1.2436 US dollars are needed to get one EUR. If you want to buy 100 Euros how much would you need in USD? You need precisely 124.36 US Dollars to buy 100 Euros. Generally you will see the USD quoted first in most currency pairs the exceptions being Pounds Sterling, Euro- Dollar, Australian Dollar and New Zealand Dollar. The predominance of the US Dollar and the fact that it figures in a majority of forex transactions is perhaps a legacy of the Bretton Woods Agreement (1944), which pegged all currencies to the U.S. dollar. “Bid” and “Ask” prices All currency pair quotes have a bid and ask price. For example the currency quote for EUR/USD would appear as EUR/USD 1.4888/1.4890. The figure on the left, i.e. the number 1.4888 is called the “bid” price. This means you can sell 1 Euro for $1.4888 The number on the right of the currency quote EUR/USD 1.4888/1.4890, i.e. 1.4890 is called the “ask” price. This means you can buy 1 Euro for $1.4890. It is important to remember that the “bid” price is always lower than the “ask” price. Spread As we have seen from example cited above, every currency pair has a "bid" and "ask" price, and further the “bid” price is always lower than the “ask” price. The difference between the “bid” and “ask” price is called the “spread”. In the currency example EURUSD 1.4888/1.4890 you will notice that there is a difference between the “bid” and the “ask” price. This difference is called as the spread. In other words, the “spread” is the difference between the highest price the buyer is willing to buy the currency and the lowest price the seller is willing to set it. For instance if you assume the “bid” price is $1 and the “ask” price is $1.3 then the spread would be $0.3. In the example of currency quote EUR/USD 1.4888/1.4890 we discussed earlier, you will notice that the spread is 2 pips being the difference between the ask price and the bid price (1.4890 minus 1.4888). “Spreads” are usually on the lower side in forex markets on account of high liquidity What is a pip? Pip, is an acronym for Price Interest Point, and represents the smallest digit in the price of a currency. Pip is also the method by which profit is calculated in a currency deal, and its value depends on the base currency of the pair. Consider this example. A move in the EUR/USD from 1.4877 to 1.4897 equals 20 pips. And a move in the USD/JPY from 89.70 to 89.90 equals 20 pips. When your trading account is in US Dollars and the U.S. dollar is the base currency, then one pip equals one dollar in a mini account or ten dollars in a standard account. So if you place a trade with one of these currencies and earn 20 pips it would translate to a profit of $20 in a mini account or $200 in a standard one. If the base currency is not the U.S. dollar, then the value of one pip is equal to one unit of the base currency. For example in the GBP/USD, the pound sterling is the base currency, so one pip is equal to one pound; So if you make 20 pip profits in GBP/USD it would mean a profit of 20 pounds Sterling in a mini account. When you make profits in these currencies, you’re making them in the base currency, which then may be exchanged into the U.S. dollar at the current exchange rate, since your trading account may not be denominated in the base currency. Summing up, in this article we have learnt what a currency pair is, and what is meant by “bid” and “ask” prices, spread and pip.
Forex Market Overview
Little Bit Of History
The foreign exchange markets as we see today have evolved through the gold exchange period, followed by the Bretton Woods Agreement, to its current setting. Although by 1973, the major industrialized nations' currencies were floated more freely across nations, coinciding with currency prices being quoted daily, it was only due to the advent of computers and technology in the 1980s that the market reaches for cross-border forex trading gained momentum extending through Asian, European and American time zones. Gradually over the years foreign exchange transactions increased intensively to all the facets we see today in forex markets worldwide. Today advances in computer technology have permitted the instantaneous transmission and receipt of currency prices across the world. These technological advances in computer networks are the primary reason behind the growth of forex trading amongst ordinary investors. How Does Forex Market Works? To understand how forex markets work, one has to understand what exactly constitutes the forex market, the institutional framework that drives this market, and importantly the process of currency price determination. Foreign exchange market is no different from any other market where buyers and sellers meet to buy or sell a commodity for a specific price. The only difference in forex markets being, it is the “currency” that constitutes the commodity, and the price at which it is exchanged conforms to the foreign exchange rate for that currency at that point in time. Export earnings of corporations, overseas remittances, and investment flows (direct or borrowed capital) constitute the main sources of foreign exchange. Individuals and entities who receive foreign currency are the primary market suppliers and they may sell foreign currency to licensed exchange dealers who in turn may pass it to other dealers in need of foreign exchange. The Central banks may sell foreign reserves to make market adjustments, and on the other side companies would need to buy this foreign exchange to make overseas paForex Market Framework The biggest foreign exchange markets are in Tokyo, London and New York and they are networked with each other using modern technology creating a seamless interface that transacts currency prices and deals almost instantaneously across the world. The institutional framework that drives the forex markets is perhaps the key to the market itself and comprises the following: Commercial and Central banks in different countries Exchange markets and firms that conduct foreign exchange deals Investment funds Brokerages and individuals By transacting with different clients in exchange conversions, commercial banks accumulate a great chunk of forex market needs and are often shared with other banks in interbank dealings. These banks (Union Bank of Switzerland, Swiss Bank Corporation, Deutesche Bank, and Citibank) with daily volume of transactions in billions of dollars greatly influence forex markets. Central Banks as for example the US Federal Reserve influence forex markets by regulating the investment climate and making market interventions and so on. Exchange Rate Exchange rate is a market-determined phenomenon. In other words, the exchange rate depends on supply and demand conditions in the market for any particular currency. A currency exchange rate is derived from the ‘spot transactions’ (means foreign exchange trades that are initiated and settled within two business days with the respective exchange) of authorized dealers with the public. This exchange rate that is reported in the price tickers that you see on your trading screen reflect the cumulative transactions undertaken by the major market makers (namely the institutions) with large value transactions reflecting more on the currency prices than a small value transaction. That’s probably one of the reasons why currency prices keep changing on your screen reflecting the rate at which the major market maker’s i.e. the institutions trade. Advantages of Forex Over Other Markets The Forex market offers many advantages, over stock market trading and other forms of investment opportunity. In forex markets financial reasons compel the execution of a forex deal and not commercial considerations. Also as compared to stock markets, exchange markets do not operate out of any specific building. In forex it is not obligatory to buy a currency to sell it later but it is enough to open buy/sell position for any currency without actually possessing it, unlike stock trading where you are committed to have the full face value of the stock before you can trade for that amount of stock. Although Forex markets can be volatile at times, it offers an advantage over a declining stock market, in that with proper knowledge of forex markets you could still key into profitable trades. On the contrary, people tend to avoid stock markets when it is in a downward spiral as no one really knows when it would start on an upward trend. In other words forex trades can be made even if the markets were rising or falling. The profits you could possibly make in stock markets pales into insignificance in comparison to the windfall profits you could be making in forex markets. For example proper leverage alone can make you huge sums in a very short time and that too by making fewer trades. The limited number of currencies traded in forex markets makes it easier to monitor market trends that relate to those currencies, whereas in the stock market a lot of factors could affect individual stocks, not to mention the innumerable number of stocks (there are several thousand stocks registered in most stock exchanges) that would have to be monitored at any given point in time. Although it has its own trends and cycles punctuated by high volatility, forex markets don’t fit into the traditional Bull/ Bear market cycle typical of stock trading. That is because currency rates always throw in new intriguing ways of making profit. For example, interest rates do not adversely affect currency markets as it would stock market indices and stocks in general. When interest rates go up, that country’s currency gets strengthened (giving profitable opportunities to the discerning trader) whereas it would depress stock markets in that country and probably cause losses to a stock trader having several open positions. Comparison of size and liquidity, and market time It is impossible to quantify the exact amount of money traded in forex markets worldwide since trading is not restricted to one single exchange or location. But several estimates put it between 1-3 trillion US Dollars a day. This is certainly lesser than the volume of stocks traded in all the major stock exchanges around the world and also far less than the gold and forex reserves of the developed world. It also far exceeds the daily volume of foreign trade transactions between different countries. Therefore in terms of size, number of participants and liquidity, forex markets are huge and offer the best opportunities to the investor. This superior liquidity in forex markets allows traders to open and close positions in a matter of a few seconds or keep that position going on for several years or perhaps indefinitely which is not possible while trading stocks. Using networked computers, forex trading offers you a world wide market, instantaneously available to you on 24/5 basis from 00:00 GMT on Monday to 10.30 GMT on Friday covering all time zones. When the sun sets in one trading center, it is dawn and the beginning of a trading day somewhere else in the world. On the contrary, stock market in any major country opens at 10 am local time and remains operative till 4p.m local time restricting the possibility of indulging in round the clock trading. Forex trading is done strictly on your calling. Since forex trading goes on 24 hours a day there is no need to have a fixed schedule, and even if you set one, it’s purely your discretion based on your own trading strategy and of course to your liking.yments. This creates a market for foreign exchange wherein a person may sell a currency today and probably emerge as a buyer the very next day.
Order Types
As a forex trader you have recourse to different types of orders in order to enter and exit the forex markets. These different types of orders allow you to specify precisely as to how your broker should fulfill your forex trades. This article explains the different order types that are possible in forex trading and emphasizes the fact that it is important that you place orders with a forex broker in the right way.
A Market order is one of the most common types of orders executed in the forex spot market. A Market order is an order to buy or sell a currency at the best available current market price. In other words, in a market order you buy as per current Ask price and if you are selling it would be as per current Bid price. This is the rule and not a choice or exception. These types of orders can be used to enter a new position (buy or sell) or to exit an existing position (buy or sell). Currency prices always keep changing with the bid and ask prices often fluctuating considerably. So a market order may not get executed at the last traded price. If the order does not get executed at the last traded price, the broker will usually requote and the trader on his part has to reconfirm the price for the market order to become effective. Generally market orders are favored over other orders with respect to more stable currencies such as EUR/USD.
All forex orders including market orders are susceptible to what is called as slippage. Slippage can be defined as the difference between the expected fill price and the actual fill price. Assume you place a market order to buy Euro at $1.3535 (expected fill price). But in reality by the time your order would have actually got filled in or executed, the rate would have moved to say $1.3537 which means there is a difference of $0.0002 (called slippage). This may or may not happen. But the fact is, this often happens even with the best of automatic trading software. Slippage is also referred to as bad fill and generally occurs during volatile market conditions as for instance during economic news releases.
You could say that slippage corresponds to what happens during the few seconds that could elapse between the time of giving the market order command (whether buy or sell) and the actual time when the transaction gets executed (when your order gets filled).
A limit order is an order placed to buy or sell currency only at a particular price and no other price. Just like a market order, a limit order is also executed at the forex spot market. But the difference with the limit order is that the transaction would take place only if the traded currency reaches the limit set by you before you bought or sold. In other words a limit order helps you to limit the maximum price you pay when you buy a foreign currency or limit the minimum price when you sell a currency. So a limit order protects you, in that you don’t buy a currency for a higher price and don’t sell a currency below a minimum price. Depending on the direction of the position, limit orders can be either limit-buy order or limit- sell order. Limit-buy order A limit-buy order is an instruction to buy the currency pair at the market price if the market reaches your specified price or lower. The limit-buy order price level is always set below the current market price. Take a look at the following example and learn how to set limit orders when buying a currency? - Assume you want to buy 1 standard lots of EUR/USD. The current bid/ask price on your screen is say 1.3535/38. Then you click on the ask price tab and buy 1 lot of EUR/USD, and then assume you set a limit of 1.3536. This means that unless the ask price is lowered from the current 1.3538 to 1.3536, this transaction will not be executed. So it helps you limit the maximum price you pay when you buy a currency. In this transaction before you place the limit order you have got to reiterate or reaffirm to yourself that you want to buy the currency only if the price were no higher than what you were willing to pay. As you can see from the above example, the limit order can be used to enter trades. Just set the entry price and the trade will be entered only at that price and no other price.
A limit-sell order is an instruction to sell the currency pair at the market price if the market reaches your specified price or higher. Note that the limit-sell order price level is always set above the current market price. How to set a limit order when selling a currency? – Consider the same EUR/USD example as above. The current bid/ask price on your screen is the same 1.3535/38. In this case you may set a limit order on the bid price for 1.3537 which means you will sell the EUR/USD currency only if it rises to at least 1.3537. So this limit order protects you in that you don’t sell a currency below a minimum price. As you can see from the above example, the limit order can be used to exit trades making a profit. The sequence is, first deciding your profit set your exit price, and then the trade gets executed only at that price and no other price. There is a key point to be reckoned with when placing limit orders. For example it is possible that your order may never get executed as the currency price may not reach your set limit order levels. Nevertheless these types of orders are definitely beneficial as when the trade goes through you get the specified purchase or sell price. To sum up a limit-buy order is an instruction to buy the currency pair at the market price once the market reaches your specified price (lower than current market price). A limit-sell order is an instruction to sell the currency pair at the market price once the market reaches your specified price (higher than the current market price). So limit orders have more to do with profits only.
Stop Order Now let’s talk of another type of order known as stop orders. A Stop Order (could be either a Sell or Buy Stop Order) which is not executed by your trading platform until the market price has reached your defined price. In other words, a stop order for a currency pair will be executed only when the currency you want to buy or sell reaches a particular price referred to as the stop price. No sooner the currency reaches this price a stop order in effect becomes a market order and gets executed. The Sell and Buy Stop order is reverse to the Sell and Buy Limit Order. The Sell Stop Order is Always set below the current market price, while the Buy Stop Order is Always set above the current market price. When the market reaches these stipulated prices, it executes and becomes a market order. Example of Buy Stop order Assume you expect EUR/USD, which is now at 1.3535 to go up in the next few hours (because of vital economic news releases), but you are unable to keep watch at the trading platform. So what do you do? Set a Buy Stop order and set it at 1.3570. If the market price hits the price, set by you to buy it becomes a market order and execute the deal. A stop order may be disadvantageous in that it is not guaranteed to be filled at the preferred price you want. Once the stop order gets triggered, it turns into a market order that is filled at the best possible price. Often this price may be lower than the price specified by the stop order. Stop-loss order A stop-loss order is akin to a limit order, but importantly it is linked to an open trade and prevents losses should the price go against you. A stop-loss order remains effective until executed or cancelled. Supposing you buy EUR/USD at 1.3535. Therefore, when, you set a stop-loss order at 1.3525 you are limiting your maximum loss. In other words if your calculation went wrong and EUR/USD drops to 1.3525 instead of moving up, the stop loss order will be automatically executed at 1.3525 and close the position for a 10 pip loss. This means you do not have to sit in front of the computer in order to monitor price levels and prevent losses from occurring. Similarly, a stop-loss order can be set on any open position.
Summary of Limit and Stop Orders Let’s summarize the salient points of Buy Stop Order and Buy Limit Order, Sell Stop Order, and Sell Limit Order, Stop orders are where the entry price (buy or sell) is set and is also how we limit our losses. Sell Stop order is set below the market price. Buy Stop order is set above the market price. Sell Limit orders is set above the market price. However Buy Limit order is set below the market price One Cancels the Other (OCO) orders are essentially a combination of two limit and/or stop-loss orders placed above and below the current market price. But significantly when one order gets executed the other order gets automatically cancelled. Consider this example. Assume that the price of EUR/USD is 1.3535. You decide to either buy say over resistance level at 1.3585 or initiate a selling position if the price falls below to say1.3500. In this OCO Order if 1.3585 is reached, the buy order will be executed and the 1.3500 sell order gets automatically canceled. So OCO order is a situation when a limit order and a stop-loss order exist at the same time. If any one order is executed the other gets automatically cancelled. This precludes the necessity for you to continually monitor your currency position in the market The above are the basic orders types available in most of the trading systems. Understanding the different types of orders will empower you with the right tools to achieve your intentions - how you want to enter the market, and how you are going to exit the market. While there may be other types of orders, market, stop and limit orders are the most common of them all. Largely finding the right type of trading software will also have a major role to play in placing forex trading orders.
Market Order
A Market order is one of the most common types of orders executed in the forex spot market. A Market order is an order to buy or sell a currency at the best available current market price. In other words, in a market order you buy as per current Ask price and if you are selling it would be as per current Bid price. This is the rule and not a choice or exception. These types of orders can be used to enter a new position (buy or sell) or to exit an existing position (buy or sell). Currency prices always keep changing with the bid and ask prices often fluctuating considerably. So a market order may not get executed at the last traded price. If the order does not get executed at the last traded price, the broker will usually requote and the trader on his part has to reconfirm the price for the market order to become effective. Generally market orders are favored over other orders with respect to more stable currencies such as EUR/USD.
Slippage
Limit Order
A limit order is an order placed to buy or sell currency only at a particular price and no other price. Just like a market order, a limit order is also executed at the forex spot market. But the difference with the limit order is that the transaction would take place only if the traded currency reaches the limit set by you before you bought or sold. In other words a limit order helps you to limit the maximum price you pay when you buy a foreign currency or limit the minimum price when you sell a currency. So a limit order protects you, in that you don’t buy a currency for a higher price and don’t sell a currency below a minimum price. Depending on the direction of the position, limit orders can be either limit-buy order or limit- sell order. Limit-buy order A limit-buy order is an instruction to buy the currency pair at the market price if the market reaches your specified price or lower. The limit-buy order price level is always set below the current market price. Take a look at the following example and learn how to set limit orders when buying a currency? - Assume you want to buy 1 standard lots of EUR/USD. The current bid/ask price on your screen is say 1.3535/38. Then you click on the ask price tab and buy 1 lot of EUR/USD, and then assume you set a limit of 1.3536. This means that unless the ask price is lowered from the current 1.3538 to 1.3536, this transaction will not be executed. So it helps you limit the maximum price you pay when you buy a currency. In this transaction before you place the limit order you have got to reiterate or reaffirm to yourself that you want to buy the currency only if the price were no higher than what you were willing to pay. As you can see from the above example, the limit order can be used to enter trades. Just set the entry price and the trade will be entered only at that price and no other price.
Limit-sell order
A limit-sell order is an instruction to sell the currency pair at the market price if the market reaches your specified price or higher. Note that the limit-sell order price level is always set above the current market price. How to set a limit order when selling a currency? – Consider the same EUR/USD example as above. The current bid/ask price on your screen is the same 1.3535/38. In this case you may set a limit order on the bid price for 1.3537 which means you will sell the EUR/USD currency only if it rises to at least 1.3537. So this limit order protects you in that you don’t sell a currency below a minimum price. As you can see from the above example, the limit order can be used to exit trades making a profit. The sequence is, first deciding your profit set your exit price, and then the trade gets executed only at that price and no other price. There is a key point to be reckoned with when placing limit orders. For example it is possible that your order may never get executed as the currency price may not reach your set limit order levels. Nevertheless these types of orders are definitely beneficial as when the trade goes through you get the specified purchase or sell price. To sum up a limit-buy order is an instruction to buy the currency pair at the market price once the market reaches your specified price (lower than current market price). A limit-sell order is an instruction to sell the currency pair at the market price once the market reaches your specified price (higher than the current market price). So limit orders have more to do with profits only.
Stop Order Now let’s talk of another type of order known as stop orders. A Stop Order (could be either a Sell or Buy Stop Order) which is not executed by your trading platform until the market price has reached your defined price. In other words, a stop order for a currency pair will be executed only when the currency you want to buy or sell reaches a particular price referred to as the stop price. No sooner the currency reaches this price a stop order in effect becomes a market order and gets executed. The Sell and Buy Stop order is reverse to the Sell and Buy Limit Order. The Sell Stop Order is Always set below the current market price, while the Buy Stop Order is Always set above the current market price. When the market reaches these stipulated prices, it executes and becomes a market order. Example of Buy Stop order Assume you expect EUR/USD, which is now at 1.3535 to go up in the next few hours (because of vital economic news releases), but you are unable to keep watch at the trading platform. So what do you do? Set a Buy Stop order and set it at 1.3570. If the market price hits the price, set by you to buy it becomes a market order and execute the deal. A stop order may be disadvantageous in that it is not guaranteed to be filled at the preferred price you want. Once the stop order gets triggered, it turns into a market order that is filled at the best possible price. Often this price may be lower than the price specified by the stop order. Stop-loss order A stop-loss order is akin to a limit order, but importantly it is linked to an open trade and prevents losses should the price go against you. A stop-loss order remains effective until executed or cancelled. Supposing you buy EUR/USD at 1.3535. Therefore, when, you set a stop-loss order at 1.3525 you are limiting your maximum loss. In other words if your calculation went wrong and EUR/USD drops to 1.3525 instead of moving up, the stop loss order will be automatically executed at 1.3525 and close the position for a 10 pip loss. This means you do not have to sit in front of the computer in order to monitor price levels and prevent losses from occurring. Similarly, a stop-loss order can be set on any open position.
Summary of Limit and Stop Orders Let’s summarize the salient points of Buy Stop Order and Buy Limit Order, Sell Stop Order, and Sell Limit Order, Stop orders are where the entry price (buy or sell) is set and is also how we limit our losses. Sell Stop order is set below the market price. Buy Stop order is set above the market price. Sell Limit orders is set above the market price. However Buy Limit order is set below the market price One Cancels the Other (OCO) orders are essentially a combination of two limit and/or stop-loss orders placed above and below the current market price. But significantly when one order gets executed the other order gets automatically cancelled. Consider this example. Assume that the price of EUR/USD is 1.3535. You decide to either buy say over resistance level at 1.3585 or initiate a selling position if the price falls below to say1.3500. In this OCO Order if 1.3585 is reached, the buy order will be executed and the 1.3500 sell order gets automatically canceled. So OCO order is a situation when a limit order and a stop-loss order exist at the same time. If any one order is executed the other gets automatically cancelled. This precludes the necessity for you to continually monitor your currency position in the market The above are the basic orders types available in most of the trading systems. Understanding the different types of orders will empower you with the right tools to achieve your intentions - how you want to enter the market, and how you are going to exit the market. While there may be other types of orders, market, stop and limit orders are the most common of them all. Largely finding the right type of trading software will also have a major role to play in placing forex trading orders.
Friday, 11 May 2012
The "Basics of Ninja Training" black belt video course contains over 8 hours of instruction. It is designed for students all over the world who are on their way to earning a first degree black belt, also known as "Shodan" rank, in Bujinkan Budo Taijutsu, ancient art of the Ninja (a.k.a. “Ninjutsu.”) In the Bujinkan, all instructors use different curriculum and testing practices. The "Basics of Ninja Training" course is so complete that any student who learns the material is well on their way to passing first degree black belt rank testing at any Bujinkan dojo (if combined with hands-on training, of course.) Whether or not you ever test for black belt rank, this video course is an invaluable life-long resource for pursuing martial arts wisdom...
This program was developed by 10th Dan Sensei Roemke at the Santa Cruz Bujinkan Dojo, where this course was filmed. Shihan Roemke has studied Bujinkan Budo Taijutsu for over 3 decades and is licensed to teach by Hatsumi Soke. Roemke specializes in all weapons including Enshin Itto Ryu Battojutsu. A former New York state Tae Kwon Do Champion, Roemke is also trained in Kenpo Kung Fu, DeCuerdas Eskrima, Seibukan Jujutsu and military fighting tactics of the Army 10th Mountain Infantry. Many years ago he founded the Santa Cruz Bujinkan Dojo in California USA where “Basics of Ninja Training” was filmed.
Basics of Ninja Training 10 BLURAY Set by Mark Roemke
Using Japanese Candle Stick Charts For Forex Trading
When traders examine Japanese candlestick charts, they usually concentrate on historical movements as well market trends on particular currency pairs which include
the support and resistance levels. Historical data will provide you accurate information about what you shall expect from market in some time and you can place the trade based on that.
If you analyze candlestick chart you can find that there is a huge trend which start and it could signal for Forex traders about where your market is headed and correct direction for trading. Before entering trend, you must think about use of moving averages indicator or Fibonacci levels and you can set up stop-loss orders based on that. The more instruments and indicators you use to analyze the market, you have more accurate knowledge about price trend and right moment to commence a trade.
There is another way to carry out Forex trading using Japanese candlestick charts which is based on concept of support and resistance levels. As per the concept, if prices do not break resistance, it could return towards level of support. Usually these Support and resistance levels are defined for a time of several days, based on your trading time frame. It could be more efficient if you can add Fibonacci levels towards this trading strategy.
Japanese candle stick analysis is traditional technique which was used in seventeenth century in Japan for construction of charts. It shows the battle between bears and bulls and provides very good picture of what is beneficial for you. Apart from that, it also states the moment when fighters could interchange their positions.
A Japanese candlestick chat is graphically composed of shadows and body. The upper shadow present in daily chart indicates the maximum value a price reached during a particular day while minimum price is indicated by lower shadow. The body of candlestick chart indicates the price of closing and opening during the trade day. If the candle is green or white, then closing price will be greater than opening price and if the candle is red or black, it indicates the closing price was lower than opening price on the day. When you analyze the candlestick chart, you must examine the figures which are formed by group of candles such ad Dodges and falling star which are commonly found. These figures indicate whether the current trend continues or will reverse. Japanese candlestick charts are used in online trading for cross-rates like GBP/EUR and for long-term trades. Use of Japanese candlestick charts is very popular and famous among experienced Forex traders.
Candlestick Forex Trading
There are several different types of charts that can be use when trading Forex. Line charts, bar chart and candle charts are some of the more commonly use ones. My favorite chart type is the candlestick chart. In today’s article we will discuss how to use the candlestick chart and what the candlesticks really represent.
Take a look at the candles shown below. One candlestick is green which tells us the price action for that candle was up. The other candlestick is read which tells us that the price action for that candle was down. Regardless of the time frame represented by the candle we can simply look to see whether the movement was bullish or bearish.
 candlestick
Notice that big green candlestick above opens at the lower end of the box and closes at the higher end of the box. This is called the body of the candle. The red candle or down candle opens at the top of the body and closes at the bottom of the body. Also take note of the wicks or shadows that stand above and below the body. These wicks represent the distance the market traveled above and below the open and closing price of the body.
Candles can also give this information in regards to the strength or weakness of a move for that candle. Notice in the picture below that the candle on the left side has a very small body with very large wicks. This type of candle tells us there was very little momentum pushing the price higher or lower. Compare that to the candle on the right where the body is very large and wicks are very small. This tells us there was very strong momentum during this time.
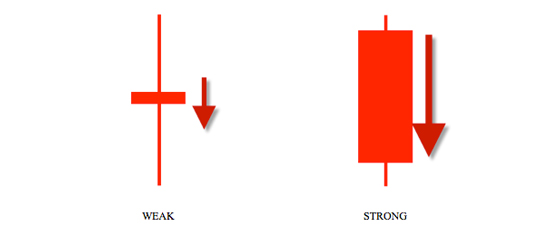
Candles like other forms of charts helps us identify the trend and support and resistance. One of the key components of any chart is to identify the direction the price is moving as well as areas of support and resistance. Using candlestick charts can help us with both of these areas of charting. Take a look at the Candlestick chart below where you can see the areas where trend is occurring and areas where resistance and support is occurring.
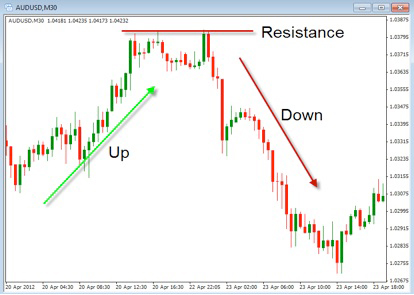
Candlestick charts are one of the several types of chart you can choose from when looking at Forex. Take time to consider the visual advantages they give you as you begin to identify the trends and the support and resistance areas of a currency pair. As you apply them to your charts I’m sure you’ll agree that they can be helpful in your trading.
Subscribe to:
Posts (Atom)