There are several different types of charts that can be use when trading Forex. Line charts, bar chart and candle charts are some of the more commonly use ones. My favorite chart type is the candlestick chart. In today’s article we will discuss how to use the candlestick chart and what the candlesticks really represent.
Take a look at the candles shown below. One candlestick is green which tells us the price action for that candle was up. The other candlestick is read which tells us that the price action for that candle was down. Regardless of the time frame represented by the candle we can simply look to see whether the movement was bullish or bearish.
 candlestick
Notice that big green candlestick above opens at the lower end of the box and closes at the higher end of the box. This is called the body of the candle. The red candle or down candle opens at the top of the body and closes at the bottom of the body. Also take note of the wicks or shadows that stand above and below the body. These wicks represent the distance the market traveled above and below the open and closing price of the body.
Candles can also give this information in regards to the strength or weakness of a move for that candle. Notice in the picture below that the candle on the left side has a very small body with very large wicks. This type of candle tells us there was very little momentum pushing the price higher or lower. Compare that to the candle on the right where the body is very large and wicks are very small. This tells us there was very strong momentum during this time.
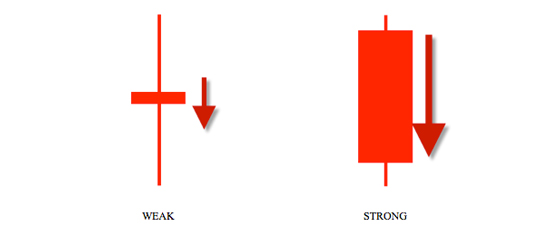
Candles like other forms of charts helps us identify the trend and support and resistance. One of the key components of any chart is to identify the direction the price is moving as well as areas of support and resistance. Using candlestick charts can help us with both of these areas of charting. Take a look at the Candlestick chart below where you can see the areas where trend is occurring and areas where resistance and support is occurring.
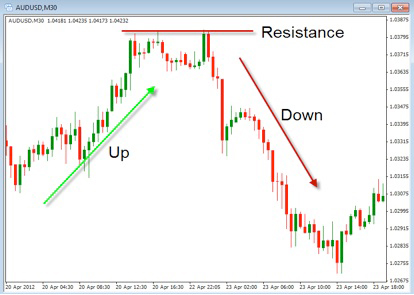
Candlestick charts are one of the several types of chart you can choose from when looking at Forex. Take time to consider the visual advantages they give you as you begin to identify the trends and the support and resistance areas of a currency pair. As you apply them to your charts I’m sure you’ll agree that they can be helpful in your trading.

No comments:
Post a Comment